
A guy on Reddit squints at an NVIDIA slide, sees “2×” at the edge of a curve, and declares that NVIDIA Rubin performance is disappointing, “only 2× at max throughput.”
In the comments, someone quietly points out that the y‑axis is TPS per megawatt. Not raw tokens per second. Efficiency.
TL;DR
- The “Rubin is only 2×” meme is a chart‑reading error sitting on top of a real confusion: which operating point are we talking about?
- Rubin’s interesting win isn’t peak FLOPS; it’s tokens per megawatt for interactive, long‑context workloads once you design the system and software around it.
- If you buy GPUs on headline “up to 5×” numbers, you’re gambling; if you buy on token/MW at your latency target, you’re doing hardware economics like an adult.
NVIDIA Rubin performance: 2× isn’t the whole story
Let’s compress the facts into one paragraph.
NVIDIA’s own developer blog shows Vera Rubin NVL72 delivering “up to 10× higher token factory throughput per megawatt” than Blackwell NVL72 on a Kimi‑K2 reasoning workload at comparable interactivity, while other parts of the same chart look more like ~2× gains at the far right “max throughput” end. The Reddit post grabbed that “2×” corner, ignored the efficiency axis, and announced that Rubin secretly under‑delivers. Meanwhile, NVIDIA’s marketing headlines still say “up to 5× inference performance” and “10× lower cost per token” for some scenarios, especially massive‑context, agentic workloads. All of these statements can be true at once, if you care about where on the curve you’re operating.
Here’s the uncomfortable bit: most teams don’t actually know where on that curve they live.
They think they’re “max throughput.” They’re usually not.
They’re somewhere in the messy middle, constrained by latency SLOs, context windows, and networking, not by raw math.
Why “up to” claims and charts diverge (operating points matter)
Picture two clusters in adjacent racks.
Same model, same number of users, same GPU count.
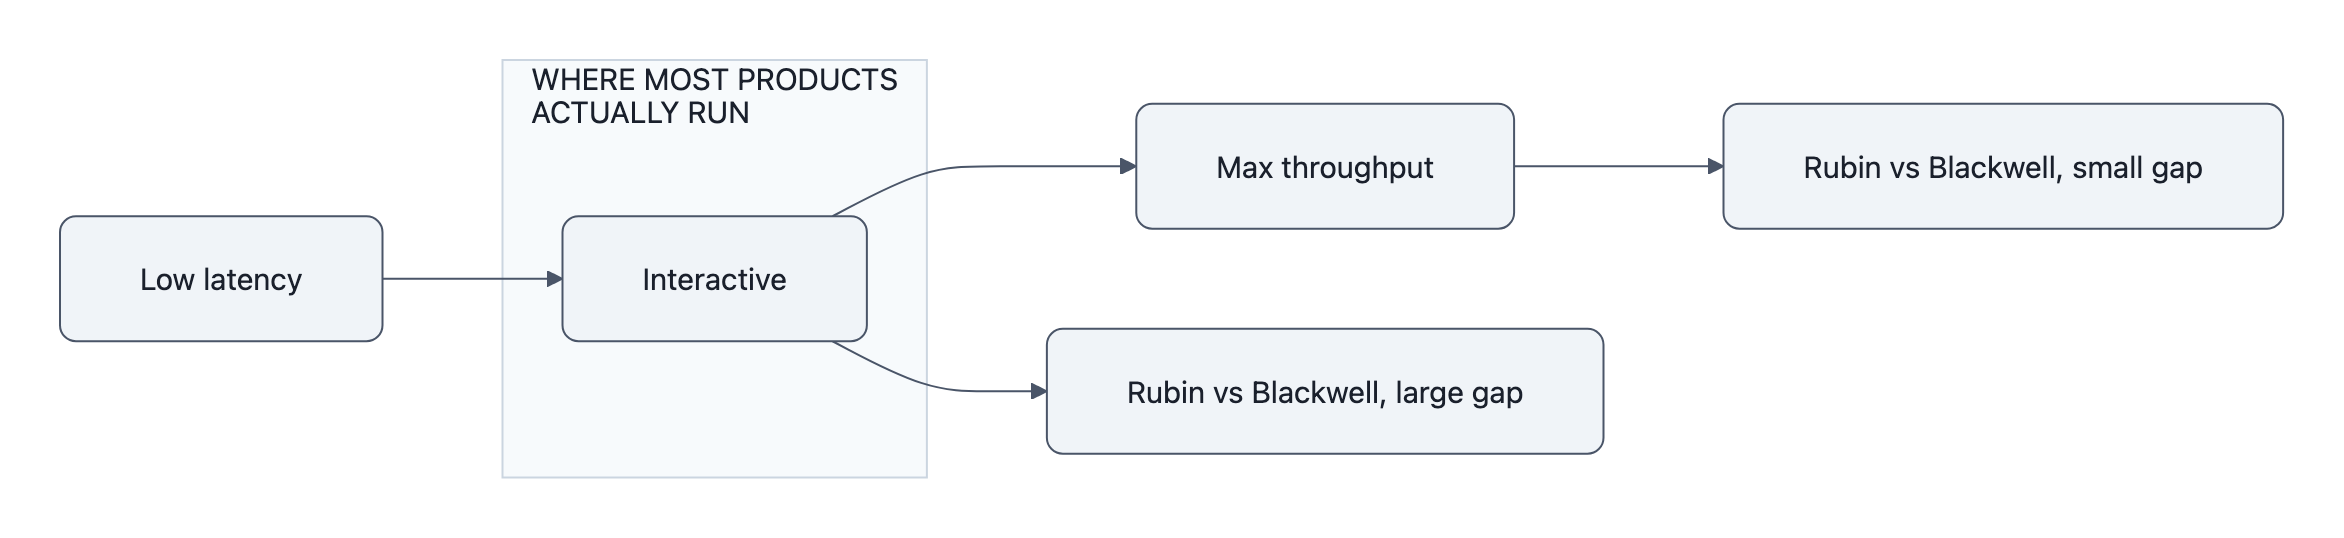
In rack A, the infra team chases a benchmark: giant batches, loose latency targets, everything tuned to push tokens per second to the ceiling.
In rack B, product demanded snappy chat and agentic workflows. Batches are smaller. Requests bounce through tools. Contexts are huge. The system never gets near that clean “max throughput” corner.
Rubin vs Blackwell looks very different in those two rooms.
NVIDIA’s charts quietly admit this. They don’t plot a single number; they sweep along an axis that trades latency per user against throughput and cost per token. At interactive points, the part of the curve where you’re not allowed to make users wait seconds for the first token, Rubin NVL72 jumps to those “up to 10× tokens/MW” gains.
It’s when you slide all the way out to “I will batch everything, users be damned” that the ratio sinks toward ~2×.
So the Reddit post accidentally asks a good question in the wrong way:
“Is Rubin really ‘only 2×’ faster at max throughput?”
The better question is: Why were you planning to operate at that point in the first place?
Most real products don’t live there. Their operating point is set by UX, SLAs, and traffic patterns, knobs marketing slides can’t see.
Tokens per megawatt vs peak FLOPS: the efficiency argument
Rubin’s architecture is weird on purpose.
You get Rubin GPUs with swollen HBM4 bandwidth and capacity. You get Rubin CPX, a prefilling monster explicitly “purpose‑built to handle million‑token coding and generative video applications,” as NVIDIA puts it. You get NVLink‑6, fatter nodes, and a system like Vera Rubin NVL72 that they happily sell as a “token factory.”
If you’re still evaluating that using peak FLOPS, you’re using a stop watch to measure the ocean.
For LLM inference at scale, three numbers matter more:
- Tokens/sec at your latency target (per user, not just per cluster)
- Tokens per megawatt at that same target
- Cost per token once you price in the whole rack, networking, memory, power, cooling, and the GPUs themselves
Peak PFLOPS tells you the ceiling if everything else disappears.
Tokens/MW tells you how much work you can actually keep doing once the power company, the interconnect, and your bill of materials show up.
NVIDIA’s own claim, “up to 10× higher token factory throughput per megawatt” for a reasoning model, is them finally saying the quiet part out loud: the scarce resource is no longer TOPS, it’s watts and rack slots.
NextPlatform’s analysis pushes this further. In their simulations, swapping Blackwell for Rubin in 64‑GPU systems wired with copper doesn’t magically multiply throughput. The interconnect and power envelope blunt a lot of the theoretical math. You only get the big wins when system design (optics, topology, software) shifts alongside the silicon.
So “Rubin throughput 2×” isn’t a gotcha.
It’s a hint that you’re staring at the wrong axis.
What buyers and engineers should benchmark before upgrading
If you’re an engineer or procurement lead, this all collapses to a painful, practical question:
“How do we decide whether Rubin is worth buying for us?”
Not for Kimi’s K2 reasoning benchmark. Not for NVIDIA’s slide deck.
For your workload.
Here’s a testing recipe that respects reality rather than marketing:
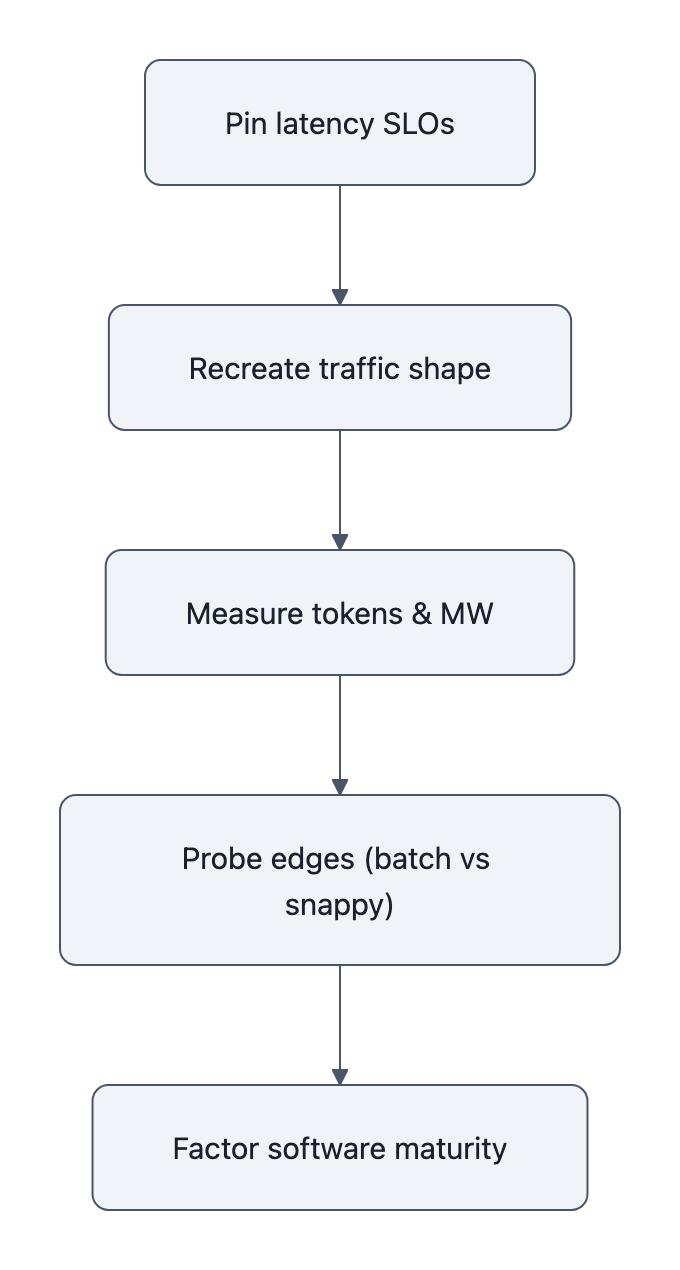
- Pin your latency SLOs.
First‑token latency, time‑to‑answer, tail behavior (p95/p99). Decide what’s non‑negotiable. Your real operating point lives inside those constraints. - Recreate your traffic shape.
Don’t benchmark with a single steady stream. Use your actual mix: chat, long‑context retrieval, quirky agent chains, spikes. Rubin CPX’s big win only appears when those million‑token sequences show up. - Measure tokens/sec and tokens/MW at that SLO.
For each candidate system, Blackwell rack, Rubin rack, Rubin+CPX, maybe even “one size smaller with optics”, collect:- tokens/sec per user
- total system power (GPUs, switches, CPUs, cooling if you can get it)
- derived tokens/MW and cost per token
The hardware economics curve you care about isn’t “FLOPS vs dollars”; it’s “tokens at SLA vs dollars and megawatts.”
Link this back to how you already think about hardware economics: effective cost per unit of useful work, not per unit of theoretical capacity.
- Probe the edges.
Run one set of tests closer to “max throughput” (heavier batching, more relaxed latency) and another closer to “snappier UX.” Watch how the Rubin‑vs‑Blackwell gap changes. You will likely see:- modest gains near the max‑throughput extreme
- much larger gains in the “feels fast” region your users actually notice
- Factor software maturity into the decision.
NVIDIA’s own engineers hint that some of Rubin’s advantage is still “software‑locked”, kernels, TensorRT‑LLM, scheduler tricks that mature over time. If your upgrade horizon is 12-24 months, assume Rubin CPX efficiency improves as those layers catch up.
After that exercise, you may very well conclude that Rubin “only” gives you 2× at your self‑inflicted benchmark corner.
But it might give you 5-10× cheaper tokens where your product actually lives.
That’s the curve you’re buying.
And it’s why engineers should stop treating NVIDIA Rubin performance as a single scalar and start treating it as a map of operating points.
Key Takeaways
- The “NVIDIA admits to only 2×” meme comes from misreading a TPS/MW chart and ignoring that Rubin’s gains vary hugely across operating points.
- Rubin’s real edge shows up in tokens per megawatt for interactive, long‑context workloads, not in a single “Rubin vs Blackwell” FLOPS ratio.
- Marketing “up to 5×” numbers and Reddit “only 2×” screenshots are both incomplete; what matters is tokens/sec and tokens/MW at your latency SLOs.
- Before upgrading, teams should benchmark with real traffic shapes, fixed latency targets, and full‑rack power to derive cost per token, not just peak throughput.
Further Reading
- Inside the NVIDIA Rubin Platform, Six New Chips, One AI Supercomputer, NVIDIA’s technical breakdown with Rubin vs Blackwell charts and tokens/MW curves.
- NVIDIA Unveils Rubin CPX, A New Class of GPU Designed for Massive-Context Inference, Official press release outlining Rubin CPX’s role in million‑token and generative video workloads.
- Copper Wires Have Already Failed Clustered AI Systems, NextPlatform’s analysis of how interconnect and power shape real throughput gains.
- NVIDIA Launches Vera Rubin NVL72 AI Supercomputer at CES, Launch coverage summarizing NVIDIA’s headline “up to 5×” and “10× lower cost per token” claims.
- NVIDIA Rubin performance and open-weight models, How Rubin‑class hardware interacts with open‑weight LLM deployment economics.
In a year or two, when the first Rubin racks start showing up on eBay and the memes have moved on, this is what will still matter: not who hit the biggest “up to” number, but who quietly optimized for tokens per megawatt at the latency their users could feel.